
How to Read Bitcoin STH-SOPR: A Practical On-Chain Guide for 2026
Learn how Bitcoin's Short-Term Holder SOPR reveals capitulation and recovery signals. Practical 2026 guide with current data from CryptoQuant and Glassnode.
chartbreaker
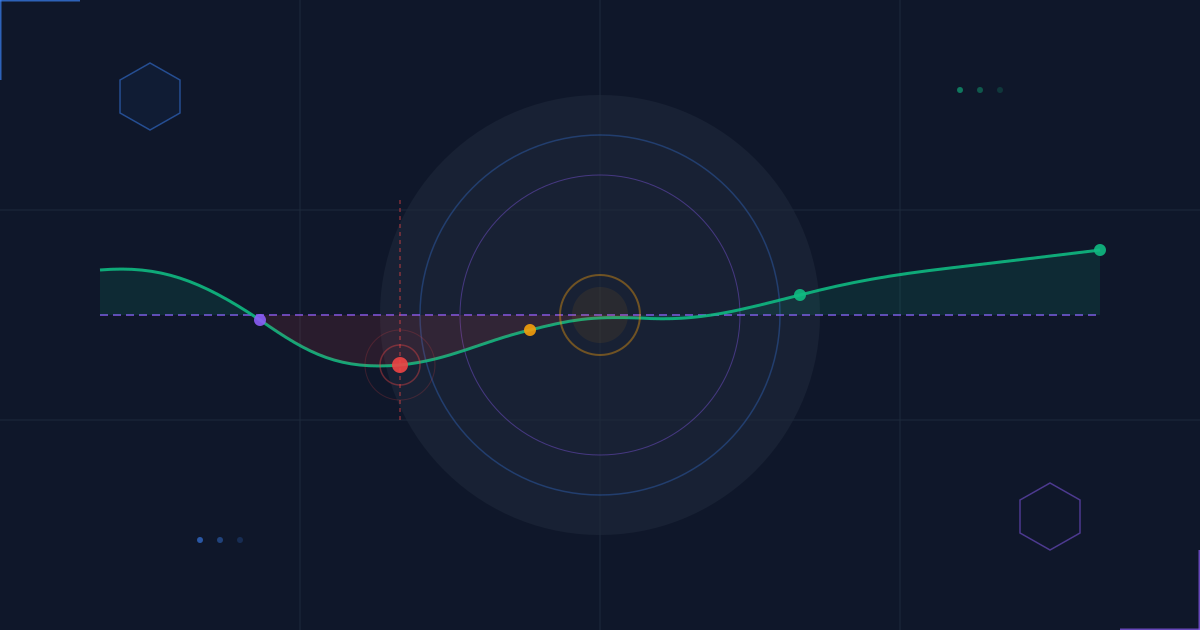
If you've ever sold Bitcoin at a loss — only to watch it recover days later — you weren't alone. On-chain data can tell you when that kind of mass capitulation is happening in real time. One of the sharpest tools for catching those moments is Short-Term Holder SOPR (STH-SOPR).
Most traders know SOPR exists. Few know how to actually use it. This guide walks you through the mechanics, interpretation, and current 2026 readings — so you can stop guessing and start reading the chain like it's meant to be read.
What Is SOPR? The One-Line Version
SOPR stands for Spent Output Profit Ratio. It measures whether coins being moved on-chain are, on average, being sold at a profit or a loss.
The formula is simple:
SOPR = Price at time of spending ÷ Price at time of acquisition
- SOPR above 1.0 → coins are being moved at a profit
- SOPR below 1.0 → coins are being moved at a loss
- SOPR exactly 1.0 → coins are being moved at breakeven
The Short-Term Holder variant (STH-SOPR) narrows this to coins that moved within the last 155 days. This filters out long-term HODLers — whose cost basis is often so low they're almost always in profit — and focuses on recent buyers: the people most sensitive to price swings.
Why STH-SOPR Is More Useful Than Plain SOPR
The full SOPR includes all spent outputs, which can be noisy. Long-term holders move coins infrequently, but when they do, they almost always show a large profit — distorting the signal.
STH-SOPR isolates the emotionally reactive cohort: people who bought in the last five months and are now facing a decision about whether to hold, sell, or panic.
This group drives a disproportionate share of market volatility. When STH-SOPR drops well below 1.0, it means recent buyers are selling at a loss — the textbook definition of capitulation. Historically, sustained readings below 1.0 have preceded recoveries.
Glassnode's breakdown separates STH and LTH SOPR specifically to capture this dynamic, noting that "during bear markets, STH-SOPR spending in loss is the dominant regime."
Reading the Signal: Four Key Zones
Zone 1 — Healthy Bull: STH-SOPR > 1.05
Recent buyers are in profit and actively realising gains. This is normal in an uptrend. Watch for spikes above 1.10 as potential local tops, where profit-taking pressure becomes significant.
Zone 2 — Distribution Warning: STH-SOPR 1.00–1.05
The margin is thin. Recent buyers are barely in profit. Any dip can flip the metric below 1.0. Often seen at range highs or during slow bleed-downs.
Zone 3 — Capitulation Zone: STH-SOPR 0.90–0.99
Recent buyers are selling at a loss. This is where market bottoms typically form. The longer the metric stays in this range, the more thorough the washout.
Zone 4 — Extreme Capitulation: STH-SOPR < 0.90
Deep loss-taking. Historically rare outside of major crash events (March 2020, May 2021, November 2022). When you see this, the sellers have nearly exhausted themselves.
Where STH-SOPR Sits in April 2026
The current cycle has produced a textbook capitulation setup. Here's what the data shows:
STH-SOPR: 0.92–0.96 (as of Q1 2026 data)
Recent buyers are realising 4–8% average losses on moved coins. This is the Zone 3/4 boundary — classic late-stage capitulation territory. Notably:
- The metric spent the entirety of Q1 2026 below 1.0, meaning buyers who entered during Bitcoin's $90K–$108K range (late 2025) are now underwater and selling into weakness.
- On April 9–10, 2026, Bitcoin exchange netflow swung to -7,974 BTC (-$582M) — a massive outflow from exchanges even as price stalled. That divergence (STH-SOPR in loss + exchange outflows accelerating) is typically read as long-term holders absorbing the capitulation.
For context: Bitcoin's exchange reserves sit at 2,693,000 BTC, down 170,000 BTC in the last six months. The slow drain of coins from exchanges alongside low STH-SOPR is historically an accumulation signal.
The MVRV–SOPR Combination: A Two-Factor Check
STH-SOPR is most powerful when read alongside MVRV (Market Value to Realized Value). Where SOPR tells you what's happening right now (are coins being sold at a loss?), MVRV tells you the big picture (is the entire market over- or under-valued relative to cost basis?).
Current readings as of April 2026:
| Metric | Value | What It Means |
|---|---|---|
| MVRV Ratio | 1.41 | Market trades at 41% premium to aggregate cost basis |
| MVRV Z-Score | ~1.2 | Compressed from 3.8 at Oct 2025 highs — well below danger zone |
| STH-SOPR | 0.92–0.96 | Recent buyers capitulating |
| Exchange Reserves | 2.69M BTC | 9-year low — steady self-custody accumulation |
The MVRV Z-Score reads 1.2 — meaningfully above the "extreme undervaluation" zone below 0 but well below the overheated zone above 3.5 that marked prior cycle peaks. This configuration (moderate MVRV + depressed STH-SOPR) looks similar to the setup that preceded the Q4 2023 recovery rally.
How to Use STH-SOPR in Practice
Step 1 — Find the Chart
The best free sources:
- CryptoQuant → Bitcoin → Market Indicators → Short-Term Holder SOPR
- CoinGlass → On-Chain → STH-SOPR
- Glassnode (free tier has limited delay)
- Bitbo.io → Charts → SOPR
Step 2 — Set Your Baseline
Always know what "1.0" looks like on the chart you're using. Some platforms display a horizontal line at 1.0; others require you to eyeball it. The value 1.0 is your pivot — everything above it is profit territory, everything below is loss territory.
Step 3 — Watch for Trend Reversals at 1.0
In bull markets, 1.0 acts as support. When STH-SOPR dips briefly below 1.0 and bounces, it signals that sellers quickly exhaust themselves and buyers absorb the dip. This is one of the cleanest re-entry signals in on-chain analysis.
In bear markets, the opposite: 1.0 acts as resistance. Rallies where STH-SOPR approaches 1.0 from below tend to fail as sellers who've been waiting to break even take the opportunity to exit.
Identifying which regime you're in (1.0 as support vs. 1.0 as resistance) is the most important contextual call to make.
Step 4 — Use 7-Day or 30-Day Moving Averages
Raw daily SOPR is noisy. Most platforms offer a 7-day MA overlay. Use it. What matters is the trend direction, not the daily reading. A 7-day MA that has been below 1.0 for three weeks but is now trending back upward is a far better signal than a single-day spike.
Step 5 — Confirm with Exchange Flows
STH-SOPR below 1.0 + exchange outflows = capitulation being absorbed (bullish context) STH-SOPR below 1.0 + exchange inflows = coins moving toward sale (continued distribution risk)
This two-factor check helps avoid misreading capitulation in a broader downtrend where the distribution is still ongoing.
Common Mistakes When Reading STH-SOPR
Mistake 1 — Acting on a single day's reading One sub-1.0 day means almost nothing. You need persistent readings below 1.0, and then the reversal back through 1.0, to have an actionable signal.
Mistake 2 — Ignoring the broader trend STH-SOPR can stay below 1.0 for months during structural bear markets (it did throughout 2022). The metric identifies capitulation character, not automatic bottoms.
Mistake 3 — Confusing STH-SOPR with LTH-SOPR Long-Term Holder SOPR moves much more slowly and requires different interpretation. Don't mix the two signals without understanding the cohort difference.
Mistake 4 — Using it in isolation Pair it with MVRV, exchange flows, and basic price structure. Any single on-chain metric, read alone, will give you false signals.
Historical Precedents Worth Knowing
| Period | STH-SOPR Trough | Event | Outcome |
|---|---|---|---|
| March 2020 | ~0.82 | COVID crash | Recovery to $60K+ within 12 months |
| July 2021 | ~0.91 | Post-China ban selloff | Recovery to $69K ATH by November |
| June 2022 | ~0.85 | Luna/3AC cascade | Extended bear; bottom in November |
| January 2023 | ~0.95 | Pre-recovery accumulation | $15K → $31K by April 2023 |
| Q1 2026 | ~0.92–0.96 | Post-ATH compression | TBD |
The June 2022 example is the cautionary one: STH-SOPR was deeply negative for months before the actual bottom. The difference was that exchange reserves were rising (distribution) rather than falling (accumulation) as we're seeing now. Context always matters.
Practical Takeaways
- STH-SOPR is your capitulation detector. When it's below 1.0, recent buyers are selling at a loss — the classic setup for a sentiment washout and potential reversal.
- The 1.0 level is the signal pivot. Sustained holds above 1.0 = bull regime. Repeated failures at 1.0 = bear regime.
- Current reading (0.92–0.96) sits in the capitulation zone. Combined with accelerating exchange outflows and a 9-year low in exchange reserves, the structural context looks like absorption rather than distribution.
- Do not use any single metric to time trades. On-chain data illuminates market character, not price direction with certainty.
Where to Learn More
If you want to go deeper on on-chain analytics, the tools below provide free access to SOPR, MVRV, and exchange flow data:
- CryptoQuant — most comprehensive free on-chain dashboard
- Glassnode — research-grade charts and weekly reports
- CoinGlass — strong on derivatives + on-chain combination view
- checkonchain.com — curated Bitcoin-specific metrics with historical context
Disclaimer: This article is for informational purposes only and does not constitute financial advice. Always do your own research before making investment decisions.
Tags
Ready to start trading?
Compare top cryptocurrency exchanges and find the best platform for you.
Compare Exchanges