
Bitcoin Perpetual Futures Funding Rates Explained: How to Read the Crowded Short Signal in 2026
Learn how bitcoin funding rates work as a trading signal. In April 2026, BTC hit its most negative funding since 2023 — here's what it means and how to act.
chartbreaker
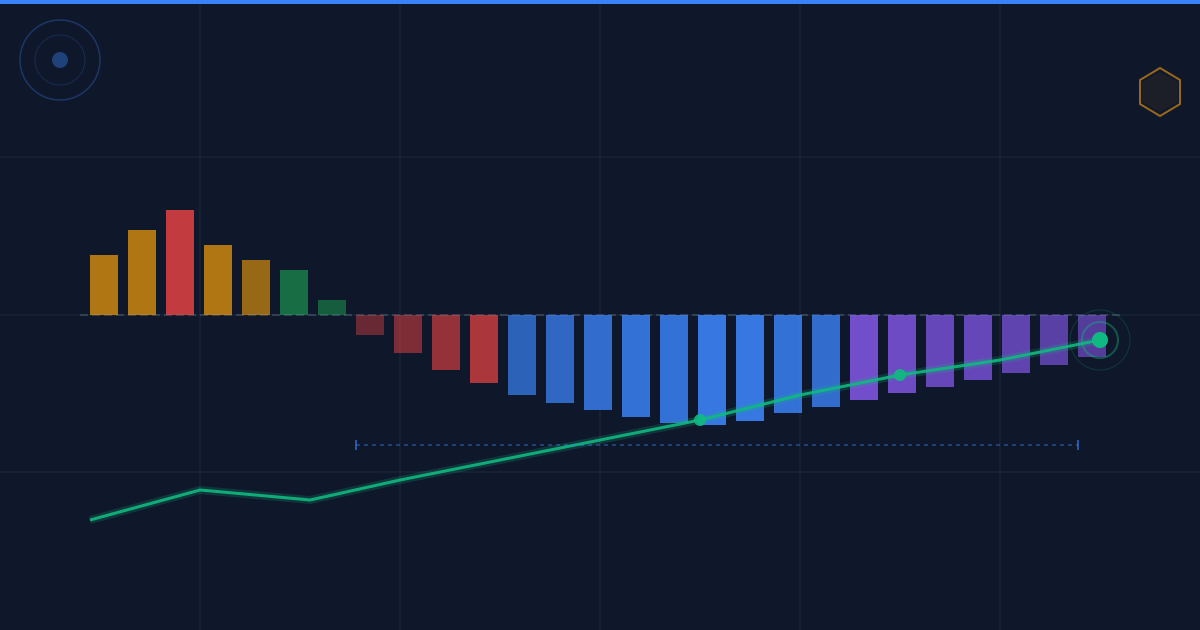
Something unusual is happening in Bitcoin's perpetual futures market right now. As of April 15, 2026, BTC has posted negative average funding rates for 46 consecutive days — the longest sustained stretch since the post-FTX bear market bottom in November 2022. The last time this happened, Bitcoin was trading at $15,500 and went on to rally to $23,000 within two months.
Understanding why this matters — and how to use it — is one of the most underrated edges you can have as a crypto trader. Funding rates are one of the few signals that give you a direct read on market positioning, not just price. This guide explains exactly how they work, what the current signal means, and how to track them yourself.
What Are Perpetual Futures Contracts?
Before diving into funding rates, you need to understand the product they're attached to.
Perpetual futures ("perps") are derivatives contracts that let traders bet on an asset's price without ever taking delivery. Unlike traditional futures with an expiration date, perps have no settlement date — you can hold a position for five minutes or five months. That flexibility is why perps dominate crypto trading volume, accounting for over $12 trillion in volume during 2025 across all major exchanges.
The catch: without an expiration date, there's no natural mechanism to keep the futures price anchored to the actual spot price. If everyone piles into long positions, the futures contract could drift far above the real Bitcoin price. That's where funding rates come in.
How Funding Rates Work
A funding rate is a periodic payment exchanged between long and short traders in a perpetual contract. It's the market's self-correcting mechanism.
The mechanics:
- When the perp price trades above spot (too many longs), the funding rate goes positive — long traders pay short traders
- When the perp price trades below spot (too many shorts), the funding rate goes negative — short traders pay long traders
Payments typically happen every 8 hours. At a neutral 0.01% every 8 hours, that's roughly 10.95% annually — significant but manageable for a short trade. At extreme positive rates of 0.1% per 8 hours, you're paying nearly 110% annualised just to hold a leveraged long position.
This creates powerful economic pressure:
- High positive funding → longs pay more → traders close longs or open shorts → price gravitates back down toward spot
- High negative funding → shorts pay more → traders close shorts or open longs → price gravitates back up toward spot
The system is elegant: funding rates function as a real-time crowdedness indicator for leveraged market positioning.
Reading Funding Rates as a Trading Signal
Not all funding rate levels are equal. Here's a practical framework:
Neutral Zone (−0.01% to +0.03% per 8h)
The market is balanced. Funding costs are low and not exerting meaningful directional pressure. This is the baseline — no strong signal in either direction.
Elevated Positive (+0.05% to +0.1% per 8h) — Caution Zone
The leveraged market is crowded long. Historically, sustained elevated positive funding often precedes sharp corrections. The mechanism is simple: over-leveraged longs are vulnerable. Any adverse price move forces liquidations, which drives the price down further, triggering more liquidations — a cascade.
Warning level: When positive funding stays above 0.05% per 8h for multiple days, reduce leverage and tighten stops.
Extreme Positive (>0.1% per 8h) — High Danger
This level signals a genuinely overheated market. Position sizing against longs becomes attractive for experienced traders. History is littered with examples of violent corrections immediately following extreme positive funding periods.
Negative (−0.01% to −0.05% per 8h) — Cautiously Bullish
Shorts are paying longs. This reflects genuine bearish sentiment in the derivatives market. When combined with rising price, it creates the setup for a "short squeeze" — shorts must eventually buy back their positions, adding fuel to any upward move.
Extreme Negative (<−0.05% per 8h, sustained) — Potential Bottom Signal
This is where things get interesting. Deeply negative funding rates, sustained over multiple weeks, have historically coincided with major bottoms. The logic: the market has gotten so aggressively short that the cost of maintaining those short positions becomes prohibitive, eventually forcing the short side to capitulate.
The April 2026 Signal: 46 Days and Counting
Right now, Bitcoin is flashing exactly this pattern.
As of April 15, 2026, BTC perpetual futures have maintained a negative 30-day average funding rate for 46 consecutive days. The 7-day moving average currently sits at approximately −0.005%, and on shorter timeframes, individual rate snapshots have dropped as low as −0.1% — territory that has historically triggered violent upside moves.
This is only the third time in Bitcoin's perpetual futures history that a streak of this length has occurred:
| Period | Duration of Negative Funding | What Followed |
|---|---|---|
| May–June 2021 | ~35 days | BTC rallied from $29K to $47K (+62%) |
| Nov 2022 (post-FTX) | ~50 days | BTC rallied from $15.5K to $23K (+48%) |
| Feb–April 2026 | 46 days (ongoing) | ? |
Two data points don't make a guaranteed pattern. But the mechanical logic is sound: 46 straight days of shorts paying longs means the short side has been hemorrhaging capital. The "crowded short" setup means any catalyst for upward price movement forces a wave of short-covering that can accelerate the move significantly.
What the "Crowded Short" Setup Actually Looks Like
The combination of rising open interest and negative funding creates what derivatives traders call a crowded short regime. Here's what makes it dangerous for bears:
When shorts pile in and push funding deeply negative, they're betting the price continues falling. But if the price instead holds or rises:
- Shorts accumulate losses relative to their margin
- Some shorts hit their liquidation threshold and are automatically closed (forced buy orders)
- Those forced buys push price slightly higher
- That higher price pushes more shorts toward their liquidation levels
- The cascade runs until the crowded short is flushed out
This is the short-squeeze mechanism — and it's amplified by the leverage typical of crypto perp markets.
Liquidation Cascades: The Other Side of the Equation
To understand why funding rates matter, you need to understand liquidation cascades — the explosive events they can trigger.
In early 2026, crypto markets experienced several major liquidation events:
- January 21, 2026: Bitcoin dropped to $89,000, triggering $1 billion in liquidations in a single day, with the vast majority from long positions
- January 30, 2026: $1.68 billion in leveraged positions liquidated in 24 hours, affecting approximately 267,000 traders — 93% of which were long positions
- February 23, 2026: A single whale position worth $61.5 million was forcibly closed on HTX exchange — the largest single liquidation event recorded on CoinGlass in 24 hours
In all three events, the mechanism was the same: high positive funding had signalled an overcrowded long market. When price fell, forced selling amplified the move.
The inverse will likely play out when the current negative funding streak resolves. The question isn't whether a short squeeze happens — it's when and from what price level.
How to Track Funding Rates: A Practical Guide
You don't need a Bloomberg terminal. Here's where to watch funding rates in real time:
CoinGlass (coinglass.com)
The industry standard for derivatives data. CoinGlass shows funding rates across all major exchanges (Binance, OKX, Bybit, dYdX), with historical charts and aggregated views. The liquidation heatmap shows price levels with the highest concentration of liquidations — essential for understanding where cascades might hit.
What to check:
- Aggregate funding rate (all exchanges combined)
- 7-day and 30-day moving averages
- Open interest alongside funding — rising OI + negative funding = crowded short
Bitcoin Magazine Pro
The 24-hour average funding rate chart here is useful for longer-term trend analysis, smoothing out the 8-hour periodic spikes.
The Block
Provides 7-day moving average BTC funding rate data, useful for tracking the macro trend rather than noise.
Practical workflow: Check CoinGlass once per day. Note whether funding is positive or negative, whether it's trending toward extremes, and whether open interest is rising or falling alongside it. Extremes in either direction — sustained over days, not hours — are the signal. Single 8-hour snapshots are noise.
The Risks: What Could Invalidate the Signal
The negative funding signal is real, but it's not a buy button. Several factors could prevent the historical pattern from repeating:
Macro headwinds: If equities continue to sell off due to trade policy uncertainty (tariffs, dollar strength), crypto correlation to risk assets could overwhelm the technical setup.
Structural shorts: Some of the negative funding may reflect basis traders who are long spot and short perps to capture the negative funding yield — not genuine bearish bets. This "cash-and-carry arb in reverse" reduces the short-squeeze potential.
Extended timelines: The 2022 post-FTX streak ran ~50 days before resolving. We're at 46. The signal gets stronger the longer it persists, but "longer" has no hard ceiling.
False bottoms: Extreme negative funding doesn't mean the bottom is already in. It means the conditions for a squeeze exist. The catalyst determines timing, and catalysts are unpredictable.
Use funding as one input among many, not a standalone trade signal. Combine it with on-chain metrics (exchange netflows, MVRV ratio), macro context, and price structure.
Combining Funding Rates With Other Indicators
The most powerful setups come when funding rates converge with other signals:
- Negative funding + declining exchange inflows (less selling pressure from spot holders) = strong setup
- Negative funding + MVRV below 1 (long-term holders underwater) = historic capitulation zone
- Negative funding + declining open interest = shorts are unwinding, not accumulating — less squeeze fuel
- Negative funding + rising open interest = shorts piling in despite the cost = maximum squeeze potential
Right now in April 2026, BTC shows negative funding alongside relatively stable open interest — suggesting genuine short accumulation rather than arb flows.
Practical Takeaways
If you're actively trading or watching the market, here's how to apply this:
- Bookmark CoinGlass and check aggregate BTC funding weekly. Log whether it's above or below 0.01%.
- Set alerts at extreme levels: positive above 0.08% per 8h (caution for longs) and negative below −0.05% per 8h (watch for squeeze conditions).
- Never use high leverage when funding is extremely positive. You are the crowded trade. The market historically punishes overcrowded positions.
- When funding is extremely negative and rising price, consider it a confirmation of underlying strength — the price is rising despite bearish positioning, which is a structurally positive signal.
- Don't chase the squeeze. By the time the cascade begins and price spikes, risk/reward has deteriorated. The opportunity is in the setup, not the fireworks.
- Always check the macro context. A negative funding signal in a strong bull market is very different from one during a structural bear market.
Conclusion
Bitcoin perpetual futures funding rates are one of the most actionable signals available to crypto traders — and one of the least understood by the broader market. The current 46-day streak of negative funding puts us in historically rare territory that has preceded significant relief rallies twice before.
That doesn't make it a guarantee. But it does mean the short side of the BTC derivatives market is paying heavily for the privilege of being bearish — and history suggests that trade eventually unwinds violently.
Watch the funding rate. Watch when it begins to normalize. That inflection point may be one of the more important moments in Bitcoin's 2026 price structure.
Disclaimer: This article is for informational purposes only and does not constitute financial advice. Perpetual futures trading involves significant risk of loss due to leverage. Always do your own research before making investment decisions. Past patterns in funding rate signals do not guarantee future performance.
Tags
Ready to start trading?
Compare top cryptocurrency exchanges and find the best platform for you.
Compare Exchanges